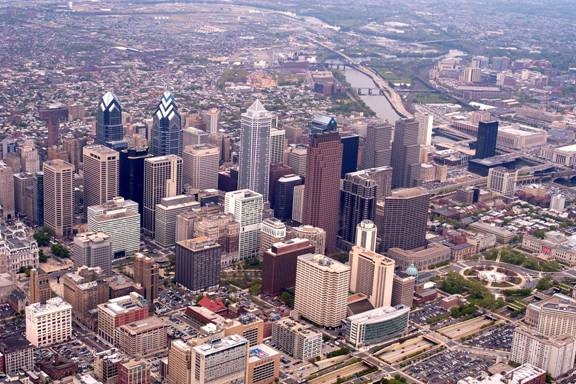
Philadelphia-Camden-Wilmington, PA


The Philadelphia-Camden-Wilmington, PA-NJ-DE-MD Metro Area, also known as Delaware Valley, is the largest city in the commonwealth of Pennsylvania, and is located towards the southern end of the Northeast megalopolis extending from Boston to Washington, D.C.

According to the 2010 census Philadelphia posted its first population increase in over fifty years at 0.6%. Each subsequent year has seen an increase in the overall population. Current projection show a consistent increase in the population over the next ten years. Philadelphia is home to many different people groups, and the immigrant population is currently increasing at a greater rate than the overall population each year. Recent city redevelopment, and an improved waterfront have attracted many wealthy foreign investors to relocate to Philadelphia.

Although numerically the city itself contains the largest population of immigrants, the population increase among immigrants is greater in the suburban area. This had led to a greater isolation of people groups in the metro area.

Click the following button to learn more about Philadelphia Send City.

Total Population: 6,228,601

Census Data

  • Foreign Born - 393,290
  • Language Spoken at Home - 561,218

[Source: American Community Survey (ACS) 5-Year Foreign Born and Language Spoken at Home]

Quick Facts

  • Immigrants currently comprise approximately 10.9% of the total population of Philadelphia.

  • Approximately 60% of all foreign-born people living in Philadelphia arrived after 1990.

  • Philadelphia is home to the second largest Italian, Irish and Jamaican-American populations in the country.

  • People Groups of Bangladesh descent grew the fastest among all ethnic groups, more than quadrupling between 2000 and 2010.

  • The Chinese people makeup the largest people group with a population of nearly 33,000 including Chinese, Mandarin, Cantonese, and Taiwanese.

  • At least 1/3 of people groups from Myanmar, Cambodia, and Bangledesh are youth.

  • Between 2000 and 2010, both Asian American and Native Hawaiian Pacific Islanders populations grew significantly, increasing 43% and 32%, respectively. In contrast, the city's total population grew just 1% over the same period.

  • The largest ancestry groups in Philadelphia, according to the 2010 census, were: Irish (13.6%), Italian (9.2%), German (8.1%), Polish (4.3%) and English (2.9%)

  • 7% of the foreign-born population are from Africa, most of which come from Nigeria, Liberia, Ethiopia, and Ghana

  • Since the late 1990's an estimated 3,300 refugees have come to Philadelphia from Liberia, which is more than from any other country.


Profile

Many cities in the Northeast have long been immigrant gateways, the Philadelphia Metro Area is one such city. The Metro Area diversity was established over a century ago by immigrants who created vibrant ethnic enclaves. Today those whose families have been in the United States for generations are joined by the newly arrived from throughout the world. Over time it experienced dramatic growth and became more diverse, evolving with the arrival of new immigrants from Southeast Asia, South Asia, and East Asia.

Philadelphia’s racial dynamics have historically been defined in terms of Black and White. But the role that Asian Americans and Latinos—especially immigrants and refugees—are playing in the (re)making of this de-industrialized city became undeniable with the release of 2010 Census data. From 2000-2010 Chinese population grew 71%, South Asian Indian population grew 47%, and the Vietnamese population grew 25%. The present day metro area is home to Chinese (Mandarin), Karen (Sgaw), Cambodian (Khmer), Vietnamese, Guamanian or Chamorro.

The Chinese comprise the largest ethnic people group and are primarily located in south Philadelphia. The Chinese people have a large influence on the city's cultural and economic realms. Philadelphia boasts one of the five largest Chinatowns in The United States which takes up over five city blocks.


People Group Profiles

Displaying 1-25 of 70 results.
PG Name Country Of Birth Affinity Bloc Primary Religion Baseline Population Total
MarathiIndiaSouth Asian PeoplesHinduism2,900
AcehIndonesiaMalay PeoplesIslam - Sunni250
Punjabi SikhIndiaSouth Asian PeoplesOther Religions - Sikhism159,910
HindiIndiaSouth Asian PeoplesHinduism38,880
VietnameseVietnamSoutheast Asian PeoplesBuddhism49,514
GujaratiIndiaSouth Asian PeoplesHinduism24,274
UrduPakistanSouth Asian PeoplesIslam11,756
Arab, MoroccanMoroccoArab WorldIslam - Sunni9,409
BengaliBangladeshSouth Asian PeoplesIslam - Sunni9,288
TurkTurkeyTurkic PeoplesIslam - Sunni4,371
Arab, EgyptianEgyptArab WorldIslam4,348
Arab, Lebanese (Muslim)LebanonArab WorldIslam - Sunni3,839
Arab, Palestinian (Muslim)IsraelArab WorldIslam3,662
PersianIranPersian-MedianIslam2,830
Albanian, GhegKosovoEurasian PeoplesIslam - Sunni2,200
Jew, IsraeliIsraelJewsEthnic Religions - Judaism1,952
Arab, Jordanian (Muslim)JordanArab WorldIslam1,362
ThaiThailandSoutheast Asian PeoplesBuddhism - Theravada1,040
Arab, IraqiIraqArab WorldIslam - Shia788
Puerto RicanPuerto RicoLatin-Caribbean AmericansChristianity - Roman Catholic122,000
MexicanMexicoLatin-Caribbean AmericansChristianity - Roman Catholic29,395
Chinese, MandarinChinaEast Asian PeoplesBuddhism27,000
RussianRussiaEurasian PeoplesChristianity - Orthodox22,620
ItalianItalyEurasian PeoplesChristianity - Roman Catholic20,593
KoreanSouth KoreaEast Asian PeoplesChristianity - Protestant20,592


Ethnic Links

Nationalities Service Center (NSC) - a non-profit organization that provides social, educational and legal services to immigrants and refugees in the Greater Philadelphia area.

Demographics of Philadelphia - an article on the various ethnic groups in the municipality of Philadelphia.